

Excel has been the office worker’s best friend for decades. For everything from data organization to chart and report creation, it’s a workhorse. But in 2025, companies are shifting to smarter, quicker, and more interactive tools and Power BI is taking the lead.
If you’re currently using Excel and aspire to enhance data skills, this blog provides an easy explanation for making the leap from Excel to Power BI. Regardless of whether you’re in admin, sales, finance, or HR, it’s simpler than you might think to learn Power BI. Let’s map out the journey in a simple, useful, and above all non-technical way.
Why Office Professionals Should Move Beyond Excel
Let us begin with the question of why it makes sense to make the switch from Excel to Power BI in 2025.
Excel Has Limits
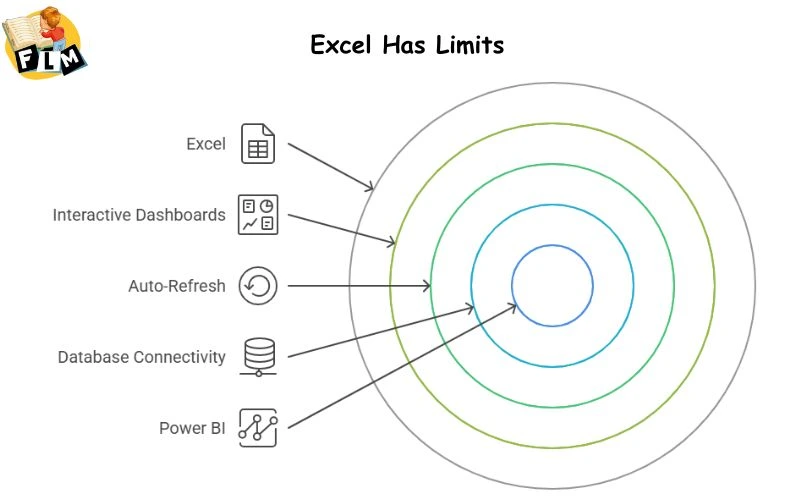
Excel is wonderful, but:
- It slows down with big data sets
- It doesn’t refresh on its own
- Dashboards are static, not interactive
In contrast, Power BI is dynamic. It links directly to databases, auto-refreshes, and creates dashboards that are graphically stunning.
Business Leaders Require Intelligent Reporting
Business decisions today are made in real time. Power BI allows you to generate interactive dashboards and reports that can be used immediately by managers without the need for a new Excel sheet every time.
You Already Have the Skills
Here’s the best part: If you’re familiar with Excel, you’re halfway there. Power BI and Excel have numerous functions in common (such as filters, pivot tables, formulas). That’s why moving from Excel to Power BI is easy for office professionals.

Looking to switch careers or upskill after a gap?
Join Frontlines Edutech’s coding & non-coding courses perfect for all levels.
Start your journey today toward a stable, rewarding career!
What is Power BI? (For Excel Users)
Power BI is a Microsoft business analytics solution employed to:
- Link to many different data sources (Excel, databases, cloud apps)
- Clean, transform, and visualize data
- Create interactive reports and dashboards
If Excel is a manual car, Power BI is an automatic one faster, smarter, and smoother.
Step-by-Step: The Transition from Excel to Power BI
Let us go through the way you, as an office professional, can transition from Excel to Power BI step by step.
Understand the Power BI Environment
Power BI has three parts in center stage:
- Power BI Desktop: Where you make reports and dashboards
- Power BI Service: Publish and share reports online
- Power BI Mobile: See your dashboards on smartphones or tablets
Download the free Power BI Desktop and take a look around. If you have experience with Excel, it will be easy to understand.
Import Your Excel Files
Yes, you can bring Excel data into Power BI directly. You don’t need to leave your beloved sheets behind.
- Open Power BI Desktop
- Click on Get Data
- Select Excel and import your file
That’s the first step in your migration from Excel to Power BI.
Learn the Power Query Editor
Power Query is Power BI’s data cleaning and transformation tool.
You may manually delete duplicates in Excel, filter rows, or resize columns. Power Query does all this for you and keeps track of your actions.
This implies:
- You clean the data only once
- Whenever you update the file, Power BI will redo the steps automatically
This saves so much time for office professionals handling repetitive reports.
Create Visuals Without Formulas
One of Power BI’s most powerful features is drag-and-drop visuals.
In Excel, creating a chart means selecting data ranges, selecting chart types, formatting, and tweaking axes.
In Power BI:
- Drag a field such as Sales onto the report
- Drag Date to the X-axis
- Done! You now have a time series graph.
No more fighting with chart design.
That is why office professionals find the switch from Excel to Power BI so appealing.
Use Slicers and Filters for Interactivity
Suppose you have sales figures by region. Rather than making several sheets in Excel, simply add a slicer in Power BI:
- Select Region as the slicer
- Click on any region to get real-time updates throughout the dashboard
This interactivity allows management to dig around in data without requesting new reports from you.
Publish and Share
You typically email files around in Excel. In Power BI:
- You publish the report to Power BI Service
- Share a link with your team
- They can see and interact with the report online
No more email threads. No more version confusion. One source of truth.
Benefits of Power BI for Excel Users
Some major benefits for those transitioning from Excel to Power BI include:
Auto-Refreshing Data
Connect to data sources such as Excel, SQL, or SharePoint and schedule automatic refreshes.
Real-Time Dashboards
Rather than opening 10 sheets, have one interactive dashboard that refreshes in real time.
Powerful Data Modeling
Easily combine data from several sheets or sources using relationships and DAX formulas.
Role-Based Access
Manage who can see what with filters and permissions.
Smarter Analysis with AI
Power BI now features AI visuals and natural language questions just type a question like What was the top-selling product in March? and have answers appear instantly.
What Skills Do You Need to Learn Power BI?
You don’t have to be a technical wizard.
If you already know:
- VLOOKUP
- Pivot Tables
- Data Filters
- Excel Charts
Then you are ready to transition to Power BI. Most office workers already possess these foundational skills.
And many online courses (such as Frontlines Edutech) provide Telugu language Power BI training, making it simpler for regional students.
How Frontlines Edutech Can Help You

At Frontlines Edutech, we’ve trained 200,000+ students, many of them from non-IT backgrounds.
We offer:
- Power BI courses in simple English and Telugu
- Real-time projects to build confidence
- Career support and resume help
- Guided transition from Excel to Power BI with real-life use cases
If you’re an office professional looking for growth, we’ll support your journey every step of the way.
Looking to switch careers or upskill after a gap?
Join Frontlines Edutech’s coding & non-coding courses perfect for all levels.
Start your journey today toward a stable, rewarding career!
Final Thoughts
As of 2025, Excel skills alone are no longer sufficient. If you aspire to:
- Work smarter, not harder
- Automate tedious work
- Create great-looking dashboards
- Get noticed in your company
Then Transition from Excel to Power BI is your next best move.
You don’t have to leave your job or attend college. Simply take one little step every day. Begin with simple tutorials. Create a small project. Enroll in a course that accommodates non-tech students.
And soon, you’ll go from being the Excel person to the Data Hero in your office.
Suggested Articles:
Why Every Working Professional Should Learn Power BI and SQL in 2025
How to Start Learning Power BI + SQL While Working Full-Time
A Beginner’s Guide to Power BI and SQL for Non-Technical Professionals
Boost Your Career with FLM’s Power BI + SQL Data Analytics Training!
Master Data Visualization, Business Intelligence, and Database Management
Learn Power BI and SQL, the essential skills trusted by 97% of Fortune 500 companies to drive data insights.
This 45+ hour live, expert-led training will help you master data analysis, data storytelling, and database querying with hands-on real-world projects and professional guidance!
What You’ll Gain?
- In-Demand Power BI & SQL Skills for High-Paying Data Roles
- Expertise in Data Visualization and Business Intelligence
- Master Database Management and Query Optimization
- Hands-On Training with 2 Major & 2 Minor Real-World Projects
- Resume Building, Career Guidance & Mock Interviews
- Exclusive: 2-Year Recording Access for the First 100 Enrollees
Unlock your future with FLM’s Power BI + SQL Course
Limited Seats Only – Enroll Now!
Visit: frontlinesedutech.com | Click Here to Enroll
WhatsApp: 8333077727


