
Data Analytics & Business Intelligence for Retail
Table of Contents
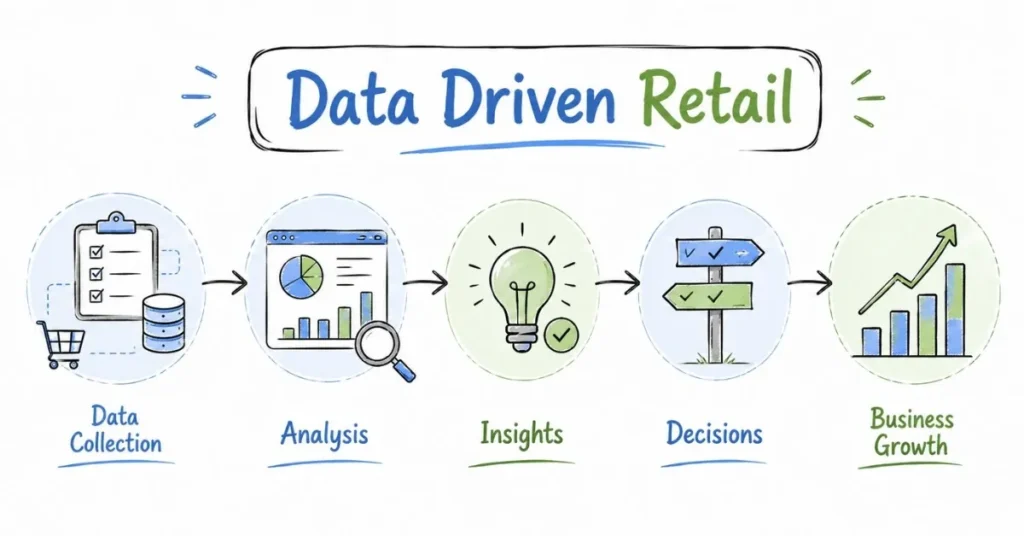
Introduction: Why Data is E-commerce's Most Valuable Asset
Let me share a story. Two e-commerce managers were given ₹10 lakhs marketing budget.
Manager A spent it based on gut feel: “Facebook works well, let’s spend 70% there. Rest on Google.”
Manager B analyzed last 6 months data: “Instagram gives 4.2x ROAS for fashion products, Facebook gives 3.1x, Google Shopping gives 5.3x for high-intent searches. Let me allocate 40% to Google Shopping, 35% to Instagram, 25% to Facebook.”
End of quarter: Manager A delivered ₹28 lakhs revenue. Manager B delivered ₹47 lakhs revenue. Same budget, different approach. The difference? Data literacy.
This is why data analytics is becoming the most sought-after skill in e-commerce. Every decision what products to stock, what prices to set, which customers to target, which channels to invest in becomes better with data.
The beautiful part for beginners? You don’t need to be a math genius or coding expert. You need logical thinking, curiosity, and willingness to learn tools. This guide shows you exactly how to build an e-commerce data analytics career in India, starting from zero.
What E-commerce Data Analysts Actually Do
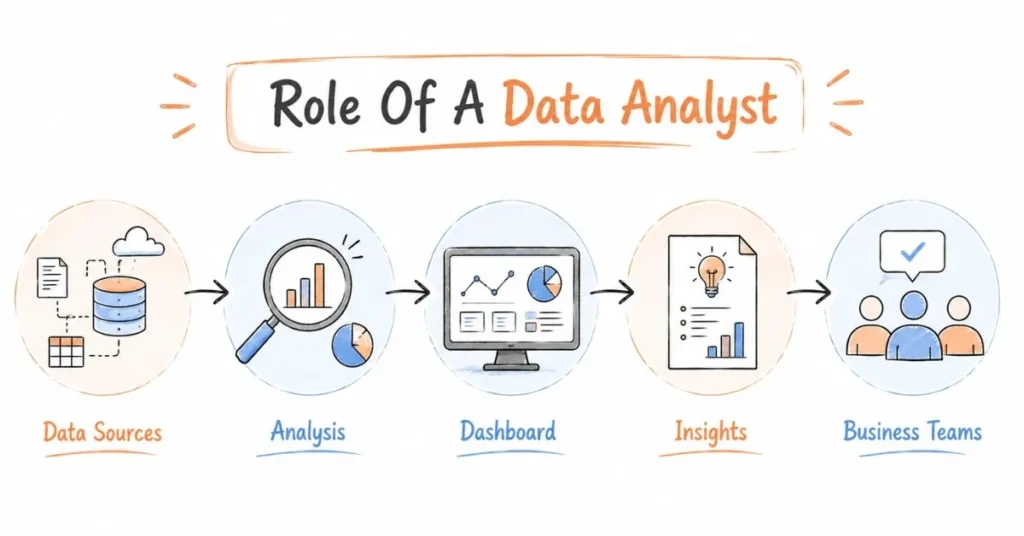
Forget the job descriptions. Here’s reality:
You’re the detective solving business mysteries:
- “Why did sales drop 15% last week?”
- “Which products have high cart additions but low purchases?”
- “What’s causing the spike in returns?”
- “Which customer segments are most profitable?”
You’re the advisor helping decision-makers:
- “We should stock up on ethnic wear before Diwali data shows 3x sales during festive season”
- “Customers who buy product A frequently search for product B next month we should create bundles”
- “Our website speed on mobile is slow, causing 20% cart abandonment this should be priority”
You’re the reporter communicating insights:
- Daily sales dashboards
- Weekly performance reports
- Monthly deep-dive analysis
- Quarterly business reviews
A typical day for Priya, Data Analyst at a fashion e-commerce company in Bangalore:
9:00 AM: Check and send automated daily sales report
- Yesterday’s sales: ₹8.2 lakhs (target was ₹8 lakhs good!)
- Orders: 342 (up 5% from last Monday)
- Average order value: ₹2,398 (down 3% investigate later)
- Top selling category: Women’s ethnic wear
10:00 AM: Investigate why certain products have high returns
- Extract data: Products with >20% return rate
- Analyze: Size issues in Brand X jeans, color mismatch in Brand Y tops
- Create report with recommendations: Update size charts, improve product photography
12:00 PM: Ad-hoc analysis for marketing team
- Marketing wants to know: Which customer segment should we target for upcoming sale?
- Analyze purchase history, order frequency, average spend
- Recommendation: Target “frequent buyers who haven’t purchased in 60-90 days” with reactivation campaign
2:00 PM: Build dashboard for operations team
- Real-time tracking of order processing time
- Warehouse-wise performance
- Delivery partner performance comparison
- Using Power BI to create interactive visualizations
4:00 PM: Deep-dive project: Understanding cart abandonment
- Where in the journey are people dropping off?
- Checkout page has 40% drop why?
- Analyze using Google Analytics funnel, Hotjar recordings
- Hypothesis: Payment failures might be high check with tech team
5:30 PM: Prepare presentation for weekly business review
- Key metrics and trends
- Wins and concerns
- Actionable insights for stakeholders
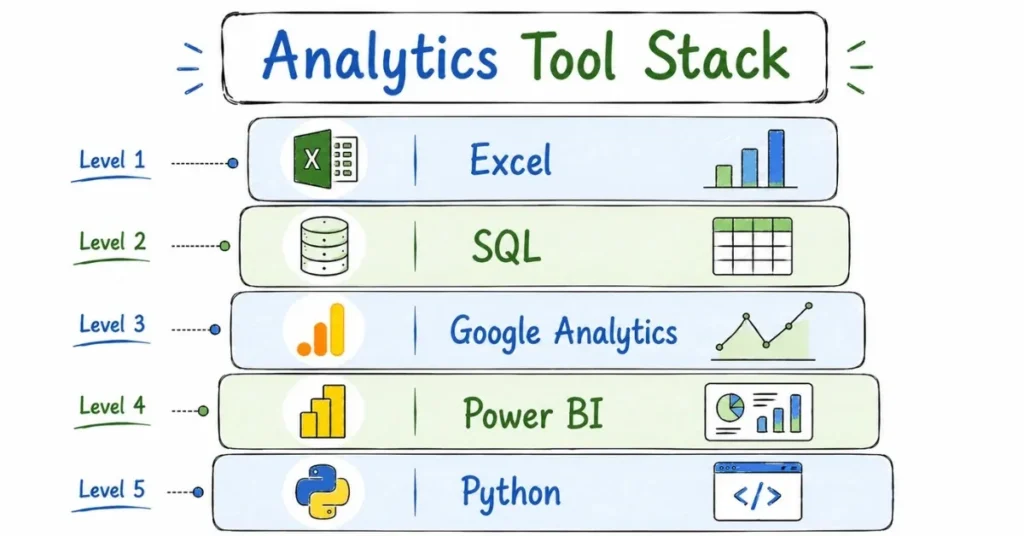
Skills you actually need (Realistic breakdown):
Core analytical skills:
Excel/Google Sheets (Non-negotiable):
- This is where 70% of your analysis happens
- Must know: VLOOKUPs, Pivot Tables, conditional formatting, basic formulas (SUM, AVERAGE, IF, COUNTIF)
- Should know: INDEX-MATCH, array formulas, data validation, charts
- Nice to have: Macros, advanced functions
Many people underestimate Excel. Master this first before jumping to fancy tools.
SQL (Structured Query Language):
- This is how you extract data from databases
- Must know: SELECT, WHERE, GROUP BY, JOIN, ORDER BY
- Should know: Subqueries, aggregations, CASE statements
- Nice to have: Window functions, complex joins
Don’t be intimidated. Basic SQL is easier than you think. You can learn enough to be functional in 2-3 weeks.
Google Analytics:
- Understanding website traffic, user behavior, conversion funnels
- Must know: Basic navigation, standard reports, goal tracking, e-commerce reports
- Should know: Custom segments, event tracking, funnel visualization
- Nice to have: Custom dimensions, advanced segments
Data visualization tools:
Power BI or Tableau:
- Creating dashboards and visual reports
- Start with: Power BI (more beginner-friendly, free version available)
- Career value: High companies love candidates who can create dashboards
Statistical thinking (Not as scary as it sounds):
You don’t need to be a statistics PhD. You need to understand:
- Averages, medians, percentiles
- Correlation (when two things move together)
- Statistical significance (is this change real or random?)
- A/B testing basics
Business acumen (Often overlooked but crucial):
- Understanding e-commerce metrics (CAC, LTV, ROAS, conversion rate, AOV, etc.)
- Knowing how the business makes money
- Understanding different departments’ objectives
- Translating data into business language
Soft skills:
Communication: Your analysis is useless if you can’t explain it. Learn to tell stories with data, not just show numbers.
Curiosity: Best analysts constantly ask “Why?” Don’t just report what happened; dig into why it happened.
Attention to detail: One wrong cell in Excel can lead to wrong conclusions and bad decisions.
The E-commerce Metrics You Must Understand
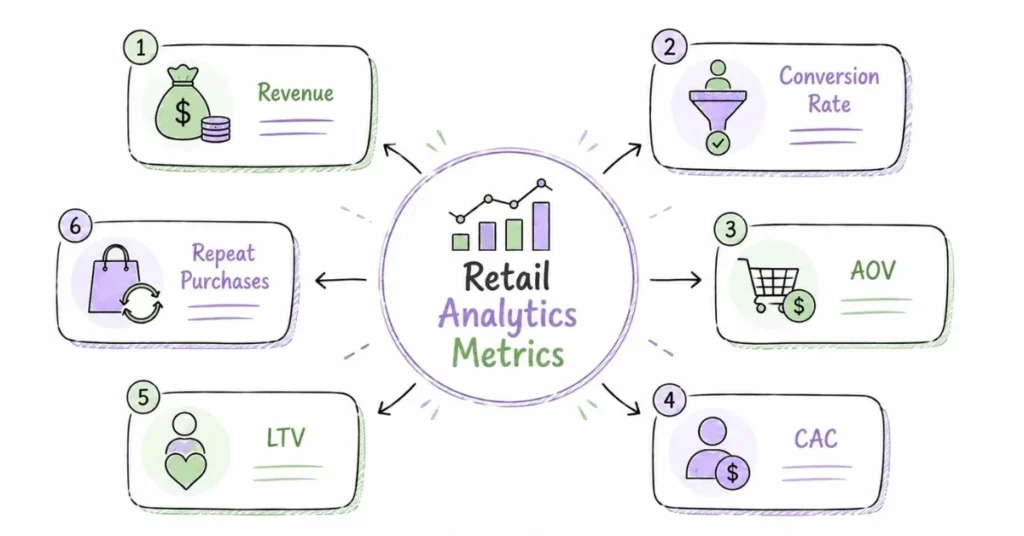
These are the metrics you’ll encounter every single day:
Revenue metrics:
GMV (Gross Merchandise Value): Total value of all orders before discounts, returns, cancellations. ₹10 lakhs GMV means customers ordered ₹10 lakhs worth of products.
Net Revenue: Actual revenue after discounts, returns, cancellations. More accurate measure of business health.
AOV (Average Order Value): Total revenue / Number of orders. If you have ₹1 lakh revenue from 50 orders, AOV = ₹2,000.
Why it matters: Increasing AOV by even 5-10% significantly impacts profitability without acquiring more customers.
Traffic & Conversion metrics:
Sessions: Number of visits to your website/app.
Users: Number of unique individuals visiting.
Conversion Rate: (Orders / Sessions) × 100. If you have 10,000 visitors and 200 orders, conversion rate = 2%.
Industry benchmark: 1-3% is typical for e-commerce. If you’re below 1%, something’s wrong. Above 3% is excellent.
Cart Abandonment Rate: (Carts created – Orders) / Carts created. Typically 60-80% in Indian e-commerce (high because many people browse without immediate buying intent).
Customer metrics:
CAC (Customer Acquisition Cost): Total marketing spend / New customers acquired. If you spent ₹1 lakh on ads and got 50 new customers, CAC = ₹2,000.
LTV (Lifetime Value): Total revenue a customer will generate over their entire relationship with your brand.
LTV:CAC Ratio: For healthy business, LTV should be 3x CAC. If CAC is ₹2,000, each customer should generate ₹6,000+ over their lifetime.
Repeat Purchase Rate: % of customers who buy more than once. Higher the better repeat customers are profitable.
RFM Analysis (Recency, Frequency, Monetary):
- Recency: How recently did they buy?
- Frequency: How often do they buy?
- Monetary: How much do they spend?
This helps segment customers. A customer who bought recently, buys frequently, and spends a lot = VIP customer. Treat them specially.
Operations metrics:
Order Processing Time: Time from order placement to dispatch.
Delivery TAT (Turn Around Time): Time from dispatch to delivery.
Return Rate: % of orders returned. High return rate hurts profitability severely.
RTO (Return to Origin) Rate: For COD orders, % of orders rejected at delivery. Big problem in Indian e-commerce.
The Learning Roadmap: 0 to Employable in 4-6 Months
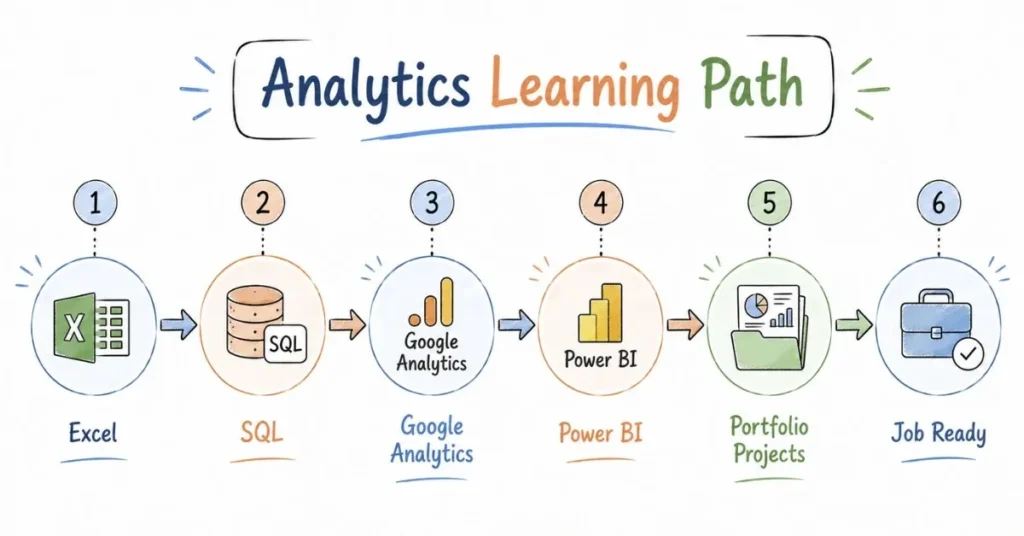
Month 1: Excel Mastery
Week 1-2: Basic functions and formulas
- Practice dataset: Download sample e-commerce data (search “e-commerce sample dataset” on Kaggle)
- Learn: SUM, AVERAGE, COUNT, IF, COUNTIF, SUMIF
- Practice: Calculate daily sales, average order value, conversion rates
Week 3-4: Intermediate Excel
- Learn: VLOOKUPs (combining data from different sheets), Pivot Tables (summarizing large data), Charts
- Practice: Create sales dashboard, analyze product performance, customer segmentation
Resources:
- YouTube: “MyOnlineTrainingHub” (excellent Excel tutorials)
- Practice files: ExcelPracticeOnline.com (free practice datasets)
Month 2: SQL Fundamentals
Week 1-2: Basic queries
- Install MySQL or PostgreSQL (both free)
- Learn: SELECT, WHERE, ORDER BY, LIMIT
- Practice: Extract data, filter, sort
Week 3-4: Intermediate SQL
- Learn: JOIN (combining tables), GROUP BY (aggregations), HAVING
- Practice: Complex queries on e-commerce database
Resources:
- SQLBolt.com (interactive, free, excellent for beginners)
- Mode Analytics SQL Tutorial (e-commerce specific examples)
- W3Schools SQL Tutorial
Month 3: Google Analytics + Business Metrics
Week 1-2: Google Analytics
- Google Analytics Academy (free official course)
- Create demo account, explore reports
- Understand: Acquisition, Behavior, Conversion reports
Week 3-4: E-commerce metrics
- Learn all metrics mentioned in previous section
- Practice calculating them using sample data
- Read e-commerce case studies
Resources:
- Google Analytics Academy
- CXL blog (advanced analytics content)
- Avinash Kaushik’s blog (analytics guru)
Month 4: Data Visualization + Dashboard Building
Week 1-2: Power BI basics
- Download Power BI Desktop (free)
- Learn: Importing data, creating visualizations, basic DAX
Week 3-4: Dashboard project
- Create complete e-commerce dashboard
- Include: Sales metrics, traffic metrics, product performance, customer segments
- Make it interactive and visually appealing
Resources:
- Microsoft Learn (free Power BI courses)
- YouTube: “Guy in a Cube” (excellent Power BI channel)
- Kaggle datasets for practice
Months 5-6: Portfolio Projects + Job Preparation
Build 2-3 portfolio projects:
Project 1: Sales Analysis Dashboard
- Use public e-commerce dataset
- Analyze trends, patterns, insights
- Create dashboard in Power BI
- Write summary of insights and recommendations
Project 2: Customer Segmentation Analysis
- Segment customers using RFM analysis
- Identify high-value vs. at-risk customers
- Create targeted recommendations for each segment
- Present findings in PowerPoint/Google Slides
Project 3: Marketing Channel Analysis
- Compare performance of different marketing channels
- ROAS calculation, channel attribution
- Budget optimization recommendations
Document everything:
- Create portfolio website (free on GitHub Pages or Wix)
- Write case studies for each project
- Include visualizations, insights, recommendations
- Link in your resume and LinkedIn
Real Success Stories from Indian E-commerce Data Analysts
Story 1: From Commerce Graduate to Data Analyst
Rahul, B.Com graduate from a tier-3 college in Jaipur, realized accounting jobs weren’t exciting. He discovered data analytics through YouTube.
His journey:
- Months 1-3: Learned Excel and SQL through free resources
- Months 4-6: Built 3 portfolio projects using public datasets
- Month 7: Applied to 50+ jobs, got 5 interviews, 2 offers
- Started as Junior Data Analyst at ₹4.2 LPA
- Year 3: Senior Data Analyst at ₹9 LPA
- Year 5: Currently Lead Analyst at ₹14 LPA
His advice: “Don’t wait to feel ‘ready.’ I started applying when I knew just 60% of what I thought I should know. You learn most things on the job.”
Story 2: Career Switch from Teaching to Analytics
Sneha, 28, was a school teacher in Bhubaneswar earning ₹3.5 LPA. She felt stagnant, wanted career growth.
Her journey:
- Evening and weekend learning (kept teaching job)
- 6 months learning Excel, SQL, Power BI
- Built portfolio showcasing hypothetical e-commerce analysis
- Took 20% pay cut initially for Data Analyst role at ₹4 LPA (scary decision!)
- Within 18 months: ₹7.5 LPA at same company
- Year 3: Switched to bigger company at ₹11 LPA
Her advice: “Hardest part was convincing interviewers I’m serious despite non-technical background. Portfolio projects proved I could do the work.”
Story 3: Tier-2 City Success
Vikram from Indore didn’t want to move to Bangalore/Mumbai. Built data analytics career in tier-2 city.
His journey:
- Started as intern at local e-commerce startup (₹15,000/month)
- Learned by doing real projects beat theoretical knowledge
- After 1 year: Full-time at ₹5 LPA
- Built strong LinkedIn presence, shared learnings
- Got remote opportunities from Bangalore companies
- Year 4: Works remotely at ₹12 LPA, lives in Indore
His advice: “Remote work changed everything for tier-2/3 city folks. You don’t have to move to expensive metros anymore.”
Salary Expectations (Realistic Numbers for India)
Entry Level (0-2 years):
- Tier 3 cities: ₹3-4.5 LPA
- Tier 2 cities: ₹4-6 LPA
- Tier 1 cities/Metros: ₹5-8 LPA
- Remote opportunities: ₹4.5-7 LPA
Mid Level (3-5 years):
- Data Analyst: ₹8-14 LPA
- Senior Data Analyst: ₹12-18 LPA
- Analytics Manager: ₹15-22 LPA
Senior Level (6+ years):
- Lead Analyst: ₹18-28 LPA
- Analytics Manager: ₹22-35 LPA
- Head of Analytics: ₹30-50 LPA
Freelance/Consulting:
- Part-time analyst: ₹30,000-80,000/month per client
- Full-time freelancer: ₹1-4 lakhs/month (with 3-5 clients)
Factors affecting salary:
- Company size (startups pay less cash but might offer equity)
- City (Bangalore > Pune > Jaipur for same role)
- Your specialization (ML, advanced analytics commands premium)
- Negotiation skills
Tools Deep Dive: What to Learn and Why
Excel:
When to use: Quick analysis, ad-hoc requests, data manipulation, reports
Career value: 10/10 You’ll use this every single day
Learning time: 1-2 months for proficiency
SQL:
When to use: Extracting data from databases (where most e-commerce data lives)
Career value: 10/10 Essential for any data role
Learning time: 1-2 months for working knowledge
Google Analytics:
When to use: Website/app traffic analysis, user behavior understanding
Career value: 9/10 Must-have for e-commerce analytics
Learning time: 2-3 weeks for basics
Power BI/Tableau:
When to use: Creating dashboards, visualizing insights for stakeholders
Career value: 8/10 Highly valued, differentiates you
Learning time: 1-2 months for functional knowledge
Python (Optional but valuable):
When to use: Advanced analysis, automation, machine learning
Career value: 9/10 if you want to grow into senior roles
Learning time: 3-6 months for working knowledge
My recommendation for beginners: Master Excel + SQL + Google Analytics first. Then add Power BI. Python can come later once you have a job.
Common Challenges and How to Overcome Them
Challenge 1: “I’m not good at math”
Reality: E-commerce analytics needs basic arithmetic (percentages, ratios, averages). You’re not doing complex calculus. If you can calculate 15% discount on ₹2,000, you can do e-commerce analytics.
Solution: Brush up on basic percentages, ratios, and averages. That’s 90% of math you need.
Challenge 2: “I don’t have a technical degree”
Reality: Many successful analysts come from commerce, economics, even arts backgrounds. Hiring managers care about skills, not degrees.
Solution: Build undeniable proof through portfolio projects. Your work speaks louder than your degree.
Challenge 3: “I don’t have experience to get a job, but need a job to get experience”
Reality: Classic chicken-and-egg problem.
Solution:
- Internships (₹10,000-20,000/month but builds experience)
- Freelance projects (small businesses need help, offer services at ₹15,000-25,000/month)
- Portfolio projects using public datasets (proves capability)
Challenge 4: “Tools are expensive”
Reality: Most essential tools have free versions:
- Excel: Google Sheets (completely free, 90% of Excel functionality)
- SQL: PostgreSQL, MySQL (free)
- Visualization: Power BI Desktop (free), Google Data Studio (free)
- Google Analytics (free)
Solution: You can learn everything needed without spending a rupee on software.
Day in Life: Junior vs. Senior Analyst
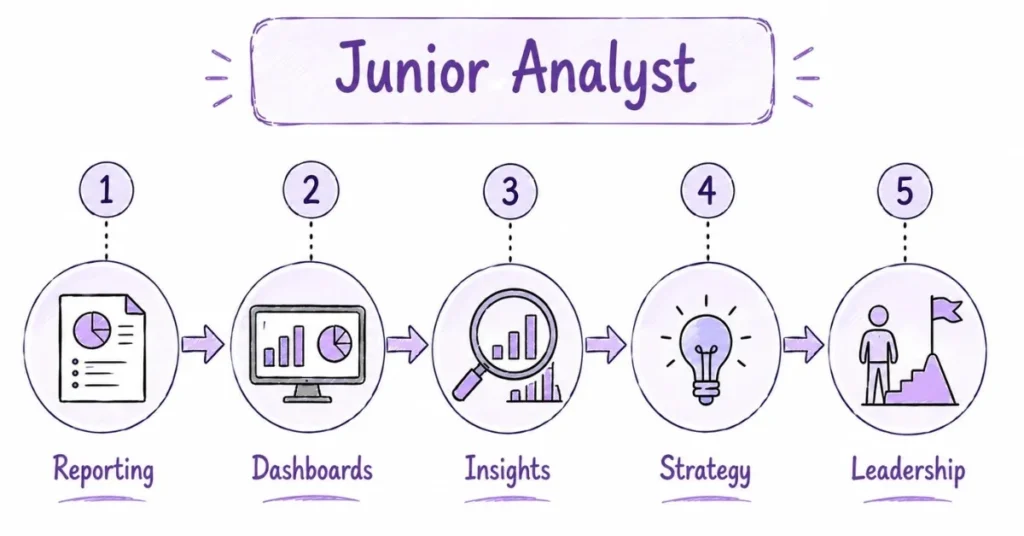
Junior Data Analyst (1 year experience):
- More tactical, execution-focused
- Running queries, creating reports, updating dashboards
- Answering defined questions
- Learning business context
- Salary: ₹5-7 LPA
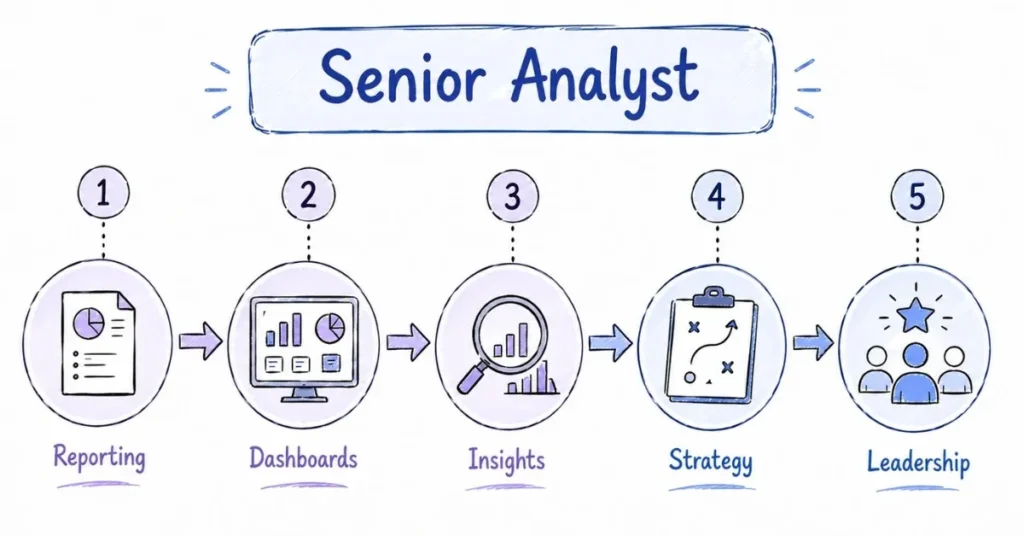
Senior Data Analyst (5 years experience):
- More strategic, insight-focused
- Defining what questions to ask
- Proactive analysis, identifying opportunities
- Mentoring junior analysts
- Presenting to leadership
- Salary: ₹14-20 LPA
The growth is clear: You start executing others’ requests, you grow into defining strategic analysis.
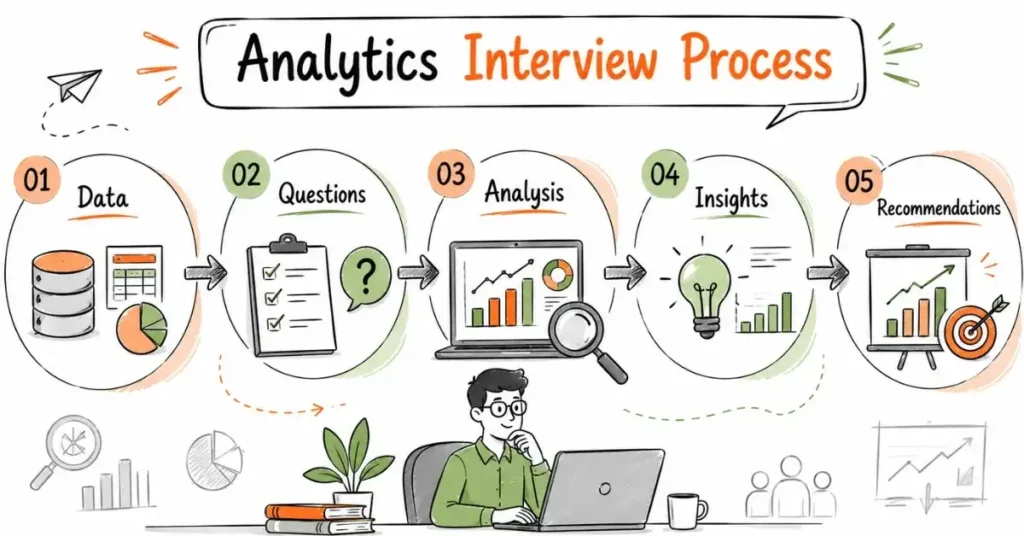
Interview Preparation: What They Actually Ask
Technical questions:
- “How would you calculate conversion rate from this data?” (Tests basic metrics knowledge)
- “Write a SQL query to find top 10 products by revenue” (Tests SQL)
- “Here’s data in Excel with errors, clean it and analyze” (Tests Excel + problem-solving)
- “Explain a time you found an interesting insight from data” (Tests analytical thinking)
Business questions:
- “How would you identify why sales dropped last month?” (Tests problem-solving approach)
- “What metrics would you track for a new product launch?” (Tests business understanding)
- “How would you prioritize which issue to fix first?” (Tests business judgment)
Case study (Common for mid-level):
Given dataset, 2-4 hours to analyze and present findings. Tests everything technical skills, business thinking, communication.
Preparation tips:
- Practice SQL on LeetCode (has SQL problems)
- Do mock analysis with sample datasets
- Prepare stories showcasing your analytical thinking
- Be ready to explain your portfolio projects deeply
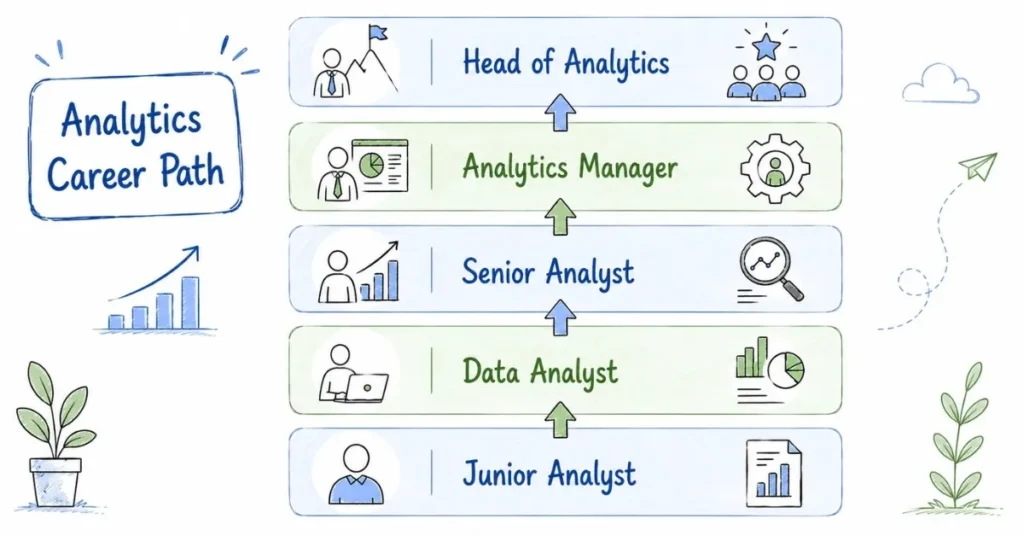
Career Growth Path in E-commerce Analytics
Year 0-2: Junior Data Analyst
- Learning, executing, building foundation
- Focus: Technical skill building
Year 3-5: Data Analyst / Senior Data Analyst
- More autonomy, handling complex projects
- Starting to specialize (marketing analytics, product analytics, etc.)
- Focus: Business impact
Year 6-8: Lead Analyst / Analytics Manager
- Managing small team, strategic projects
- Presenting to senior leadership
- Focus: Strategy + people management
Year 9+: Head of Analytics / Director
- Building analytics function, team building
- Setting data strategy for organization
- Focus: Vision + leadership
Alternative paths:
- Specialist route: Become deep expert without people management (Principal Analyst roles)
- Pivot to data science: Add machine learning, predictive modeling
- Pivot to business roles: Many analysts become Product Managers, Business Managers (data literacy is huge advantage)
Final Reality Check: Is E-commerce Analytics Right for You?
You’ll love this career if:
- You enjoy solving puzzles
- You’re comfortable with numbers
- You like finding patterns
- You want data-driven career with clear impact
- You enjoy continuous learning
You might struggle if:
- You need creative outlets (this is more logical than creative)
- You dislike repetitive tasks (reporting has repetitive elements)
- You want immediate gratification (some analyses take weeks)
- You hate attention to detail (one wrong number ruins analysis)
The good news: Unlike many careers, you can try this risk-free. Spend 1 month learning Excel and SQL. If you enjoy it, continue. If you hate it, you’ve lost nothing but discovered it’s not for you.
Your Starting Line: What to Do Today
- Download sample e-commerce dataset from Kaggle
- Open Google Sheets (or Excel if you have it)
- Start exploring the data: What patterns do you see? What questions can you answer?
- Commit to 1 hour daily learning for next 90 days
- Join online communities: Reddit r/analytics, LinkedIn groups on data analytics
The barrier to starting is zero. The potential is enormous. The question is: Will you start today or keep thinking about it?
Every expert analyst was once a complete beginner staring at a spreadsheet wondering “What do I do?” The difference? They kept going.
Your e-commerce data analytics career starts now.